
This site is a work in progress and will continue to change as our software evolves. Every effort will be made to publish updates promptly as they are released. Please email any questions or comments to pburgio@foscd.com.
Reports #

In This Section #
- Introduction
- Generate Reports
- Saved Reports
- Ad Hoc Report
Introduction #
The Reports module enables you to run various standard and customizable reports to consolidate and harness the data found within FOScore®. Pop-ups must be enabled for reports to open.
Generate Reports #
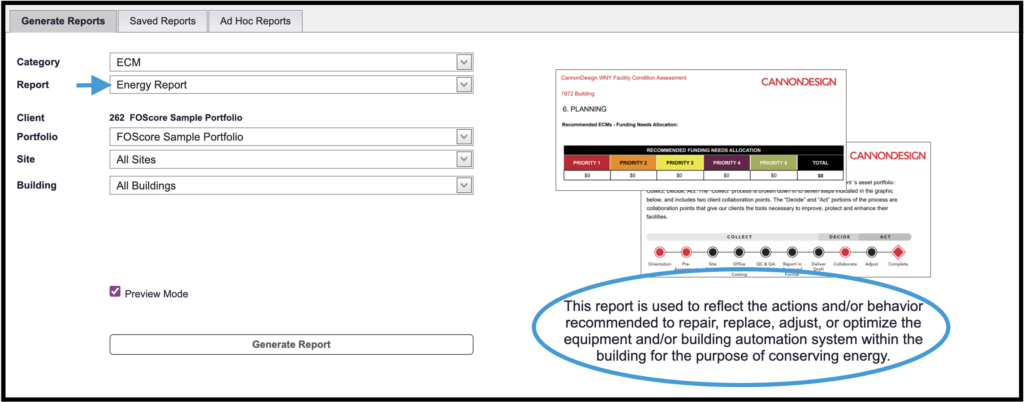
There are 5 drop-down menus in the Generate Reports tab:
- Category
- The category of report you’d like to run (All, ECM, Excel, Form, General).
- Selecting a specific category will refine the rest of the drop-down menu choices.
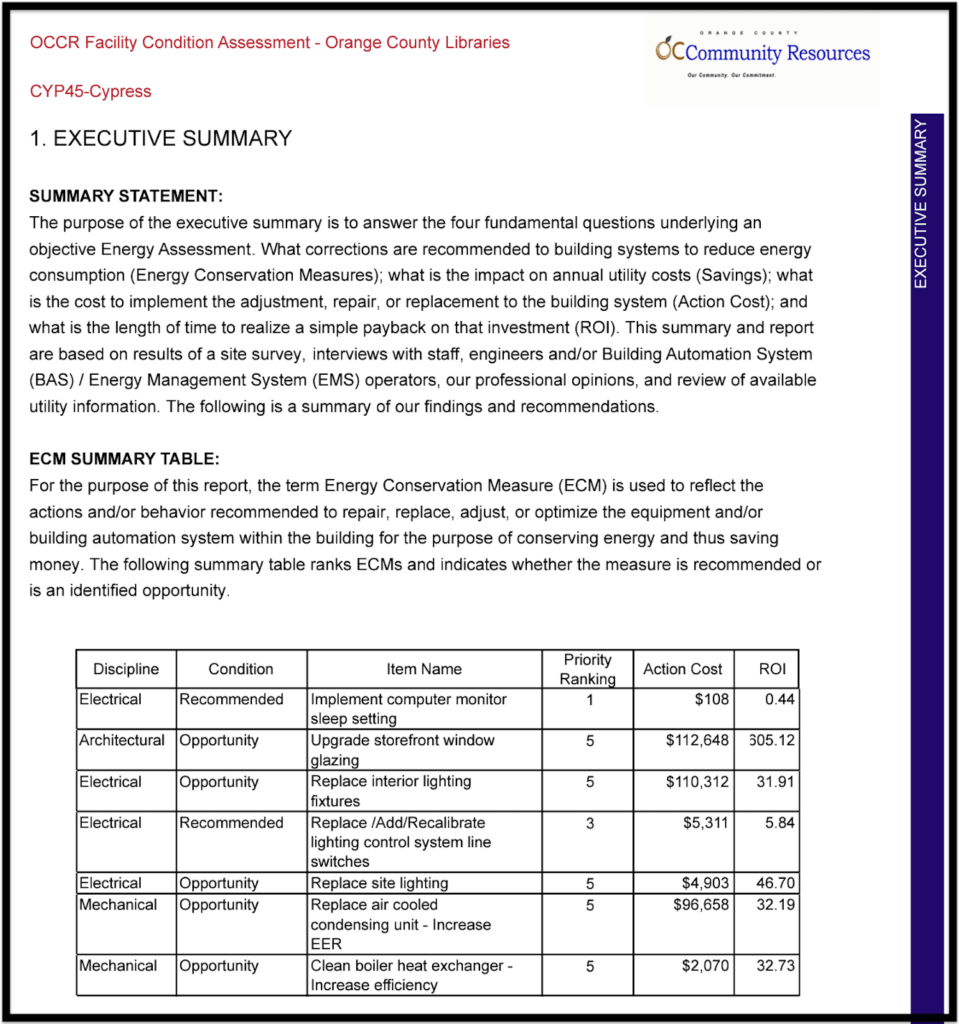
- When a report is selected, there are previews and descriptions to the right of the report selections.
- Report – Select from a list of reports available to the subscriber, administrator, or user.
- Portfolio
- Site
- Building
To run a report:
- Select the choices from the drop-down menus for the report you’d like to run and select Generate Report.
- All menus must have a selection, or the report cannot be generated.
- After the report is ready for viewing, the Download Your Report link will appear.
- Click the link and the report will download to your device’s downloads folder.
- To locate your downloaded report, navigate to the downloads folder on your device.
- The report’s name will be determined by the type of report chosen.


Saved Reports #
- All existing reports will be saved in the Saved Reports section.
- Reports are sorted from newest to oldest.
- You can view the name, date modified, and the size of each file.

- To view options for a preexisting report, click the check box to the left of the name.
- Once a report is selected, a bar of options will become available.


Reading second from left to right, the available options are: Rename, Move, Copy, Delete, Refresh, and Download.


Ad Hoc Reports #
The system supports Ad Hoc Report queries.
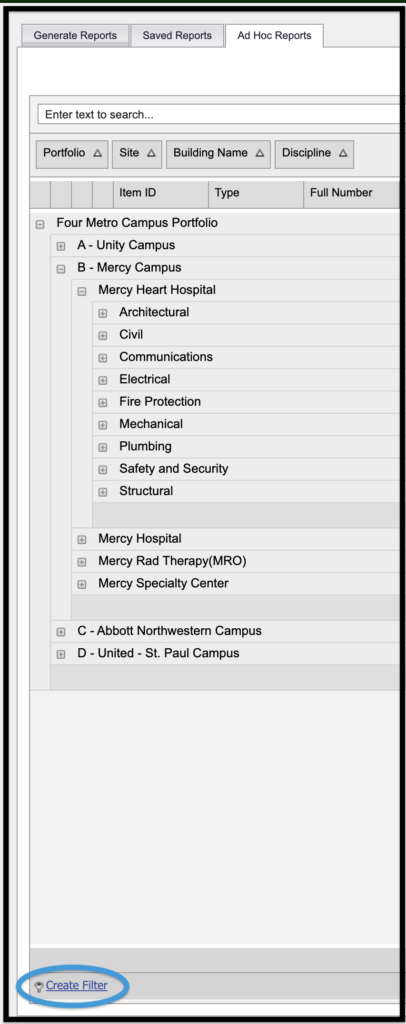
Ad Hoc queries are a customizable feature dedicated to specific data sets that a user may request, resulting in a fully interactive data grid.


Click ‘Show Data’ to run the selected query and view it in the grid.
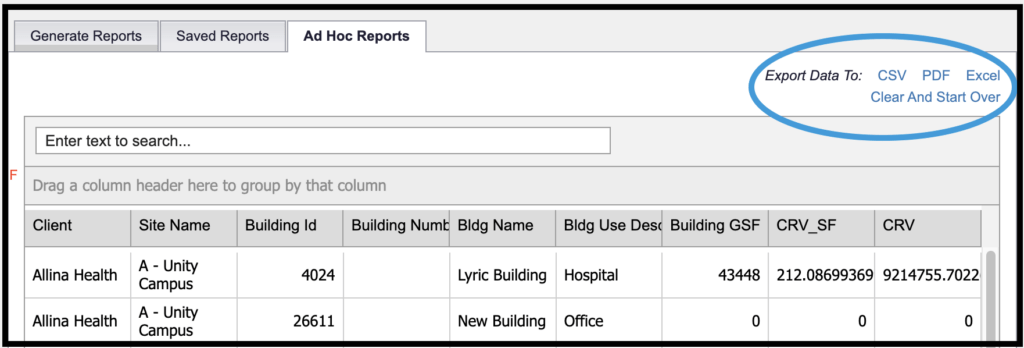
Column headings and order are determined and customizable by the query. By default, the system will group by Portfolio, Site, and Building. Users can customize the grid view by moving column headings into the ‘drag’ field shown below. The search bar provides the option of sorting by keyword.


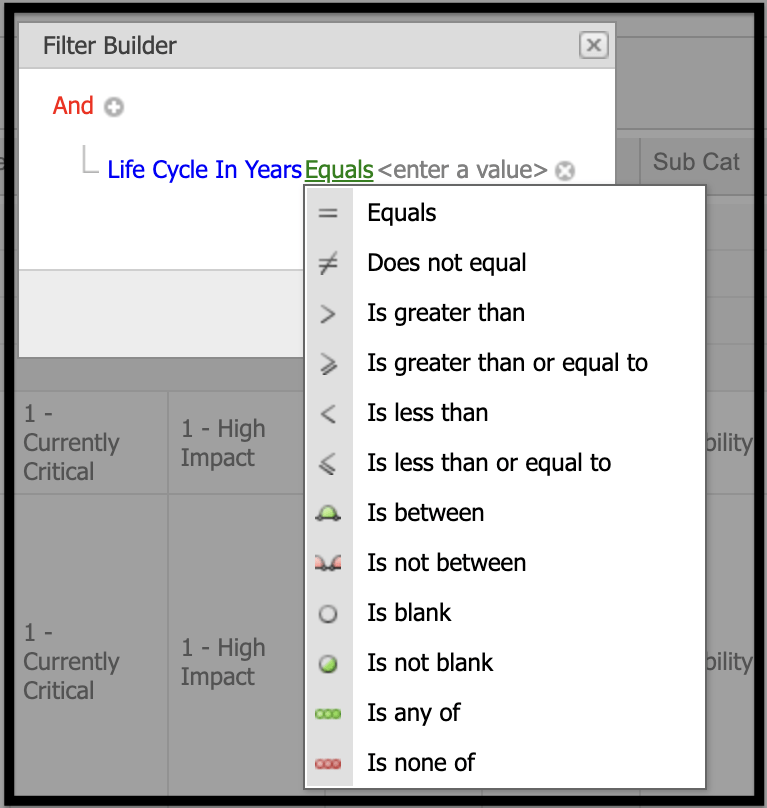
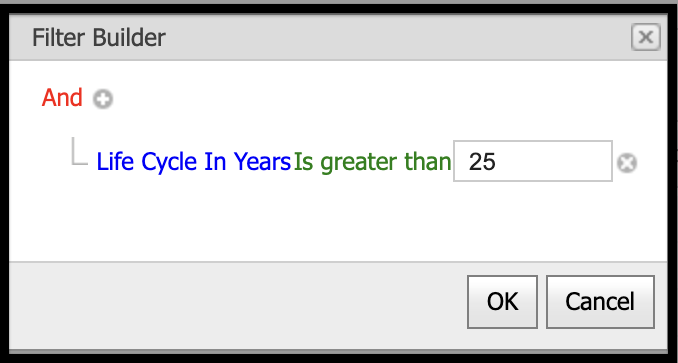
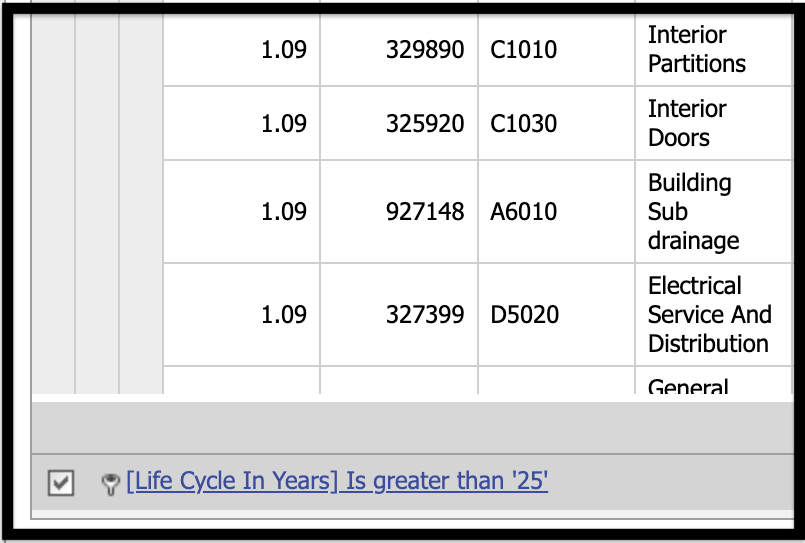
At the bottom of the screen, a filter option with a query builder allows the user to customize the report further.
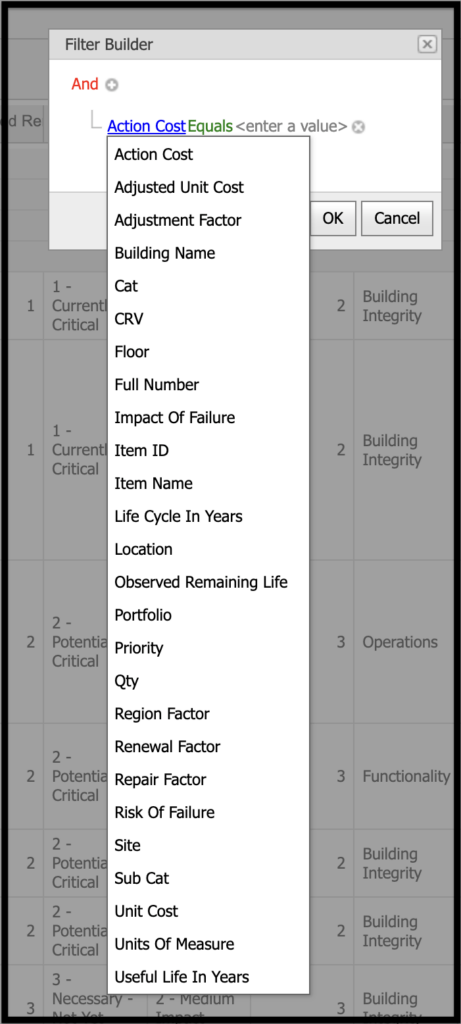
In the upper right corner, an Export Data feature enables you to export your report to CSV, PDF, or Excel. The option to clear the query and start over is also located in this area.

© Copyright 2024, FOS of CannonDesign – All Rights Reserved – Confidential and Proprietary