
This site is a work in progress and will continue to change as our software evolves. Every effort will be made to publish updates promptly as they are released. Please email any questions or comments to pburgio@foscd.com.
Reference #

In This Section #
- Introduction
- Cost Database Viewer
- Escalation
- Source
- FOS Building Index
- Percentage Change From Prior Year
- Escalation Table
- Data Grid
- Calculating Forecasted Cost
- Reference Admin
- Escalation Matrix Maintenance
- Update Table From API
Introduction #
The FOScore® Reference Module includes a Cost Database Viewer and Escalation data. These resources are used to analyze current costs as well as forecast future costs.
Cost Database Viewer #
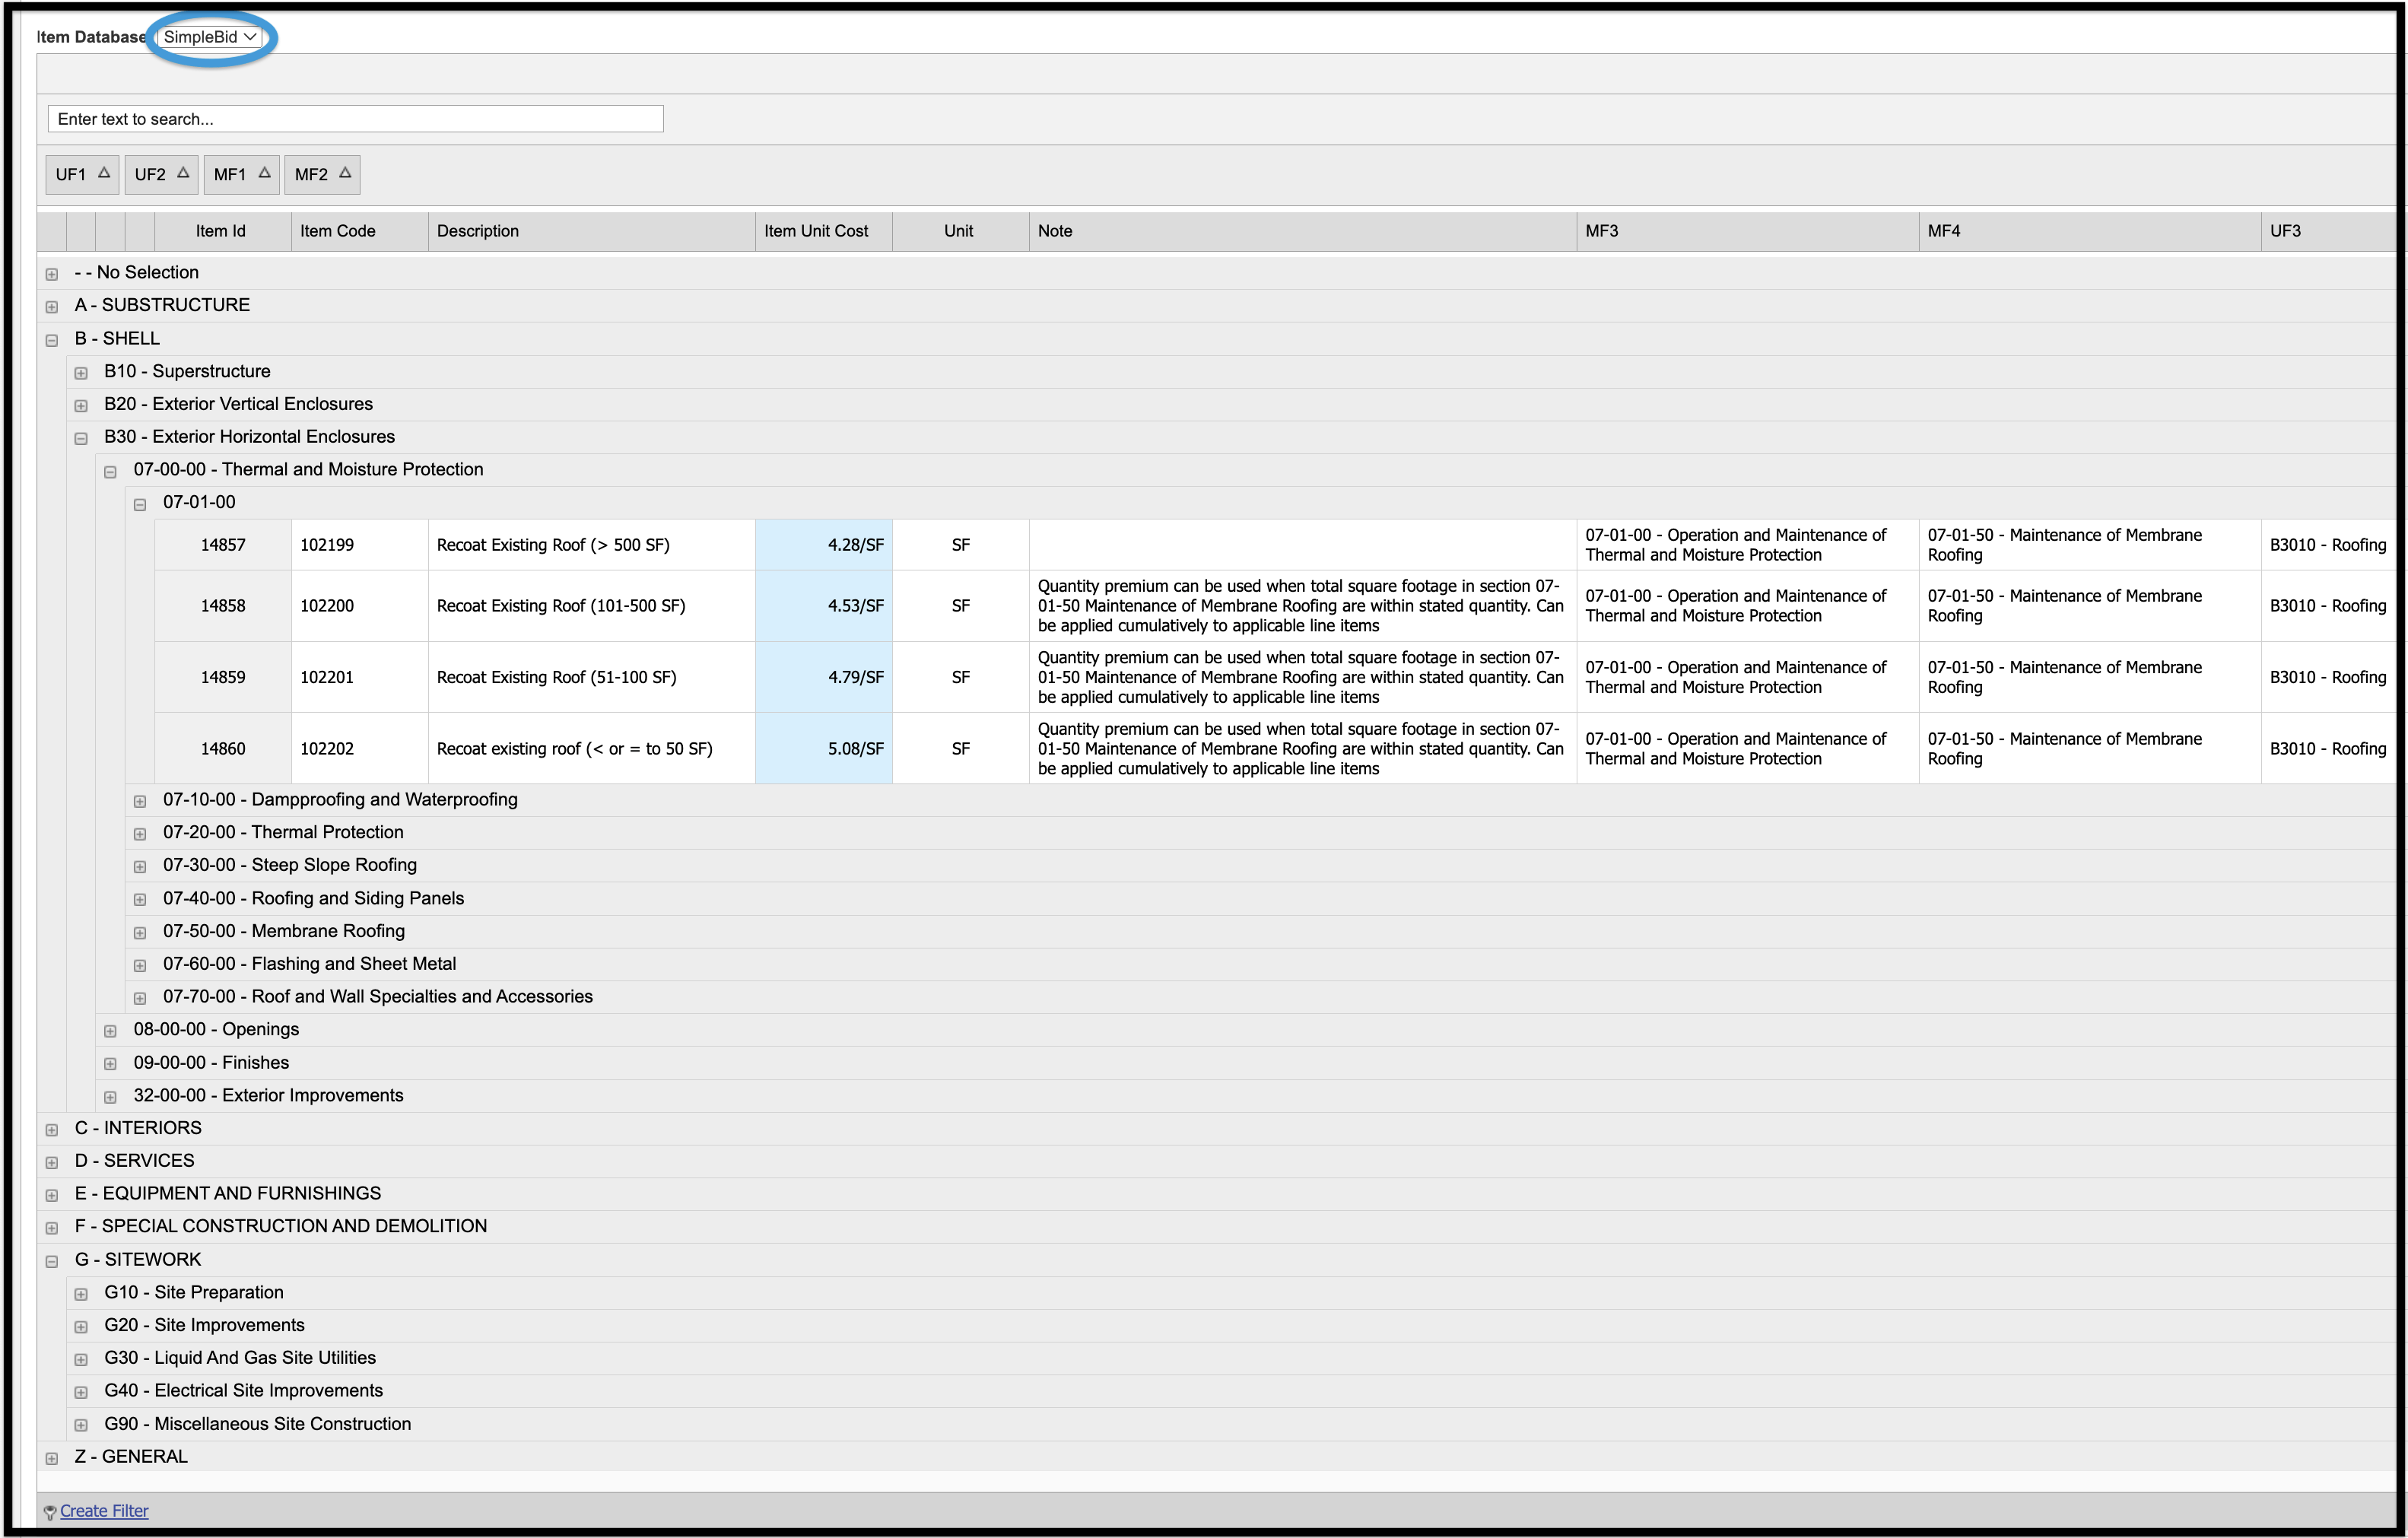
The Cost Database Viewer tab of the Reference Module provides an opportunity to group, browse, and search available Cost Item Databases.
To begin, click on the Item Database selection in the upper left. The dropdown menu offers two choices, My Items and Simplebid®, other options may be added for client-created references.
- My Items enables you to view items that you have entered into the system in the Item Database Maintenance section of the Estimating Module.
- SimpleBid® consists of a database of more than 16 thousand items that can be accessed using either MasterFormat® or UniFormat® coding.
Next review, and if needed, change the Rate Table at the top right. Unit costs are calculated, in part, using the selected Rate Table.
Find the desired item and the related unit cost and note. More detailed item data is available in the Estimating Module.


Customize Layout #
In the upper right corner of the Cost Database Viewer, you will find the Customize Layout option. Click this option if you would like to modify the look of the database viewer by changing what items you see, how they are sorted and grouped, in addition to other options.

The image below shows some of the options available in the Sorting tab of the Customize Layout feature.
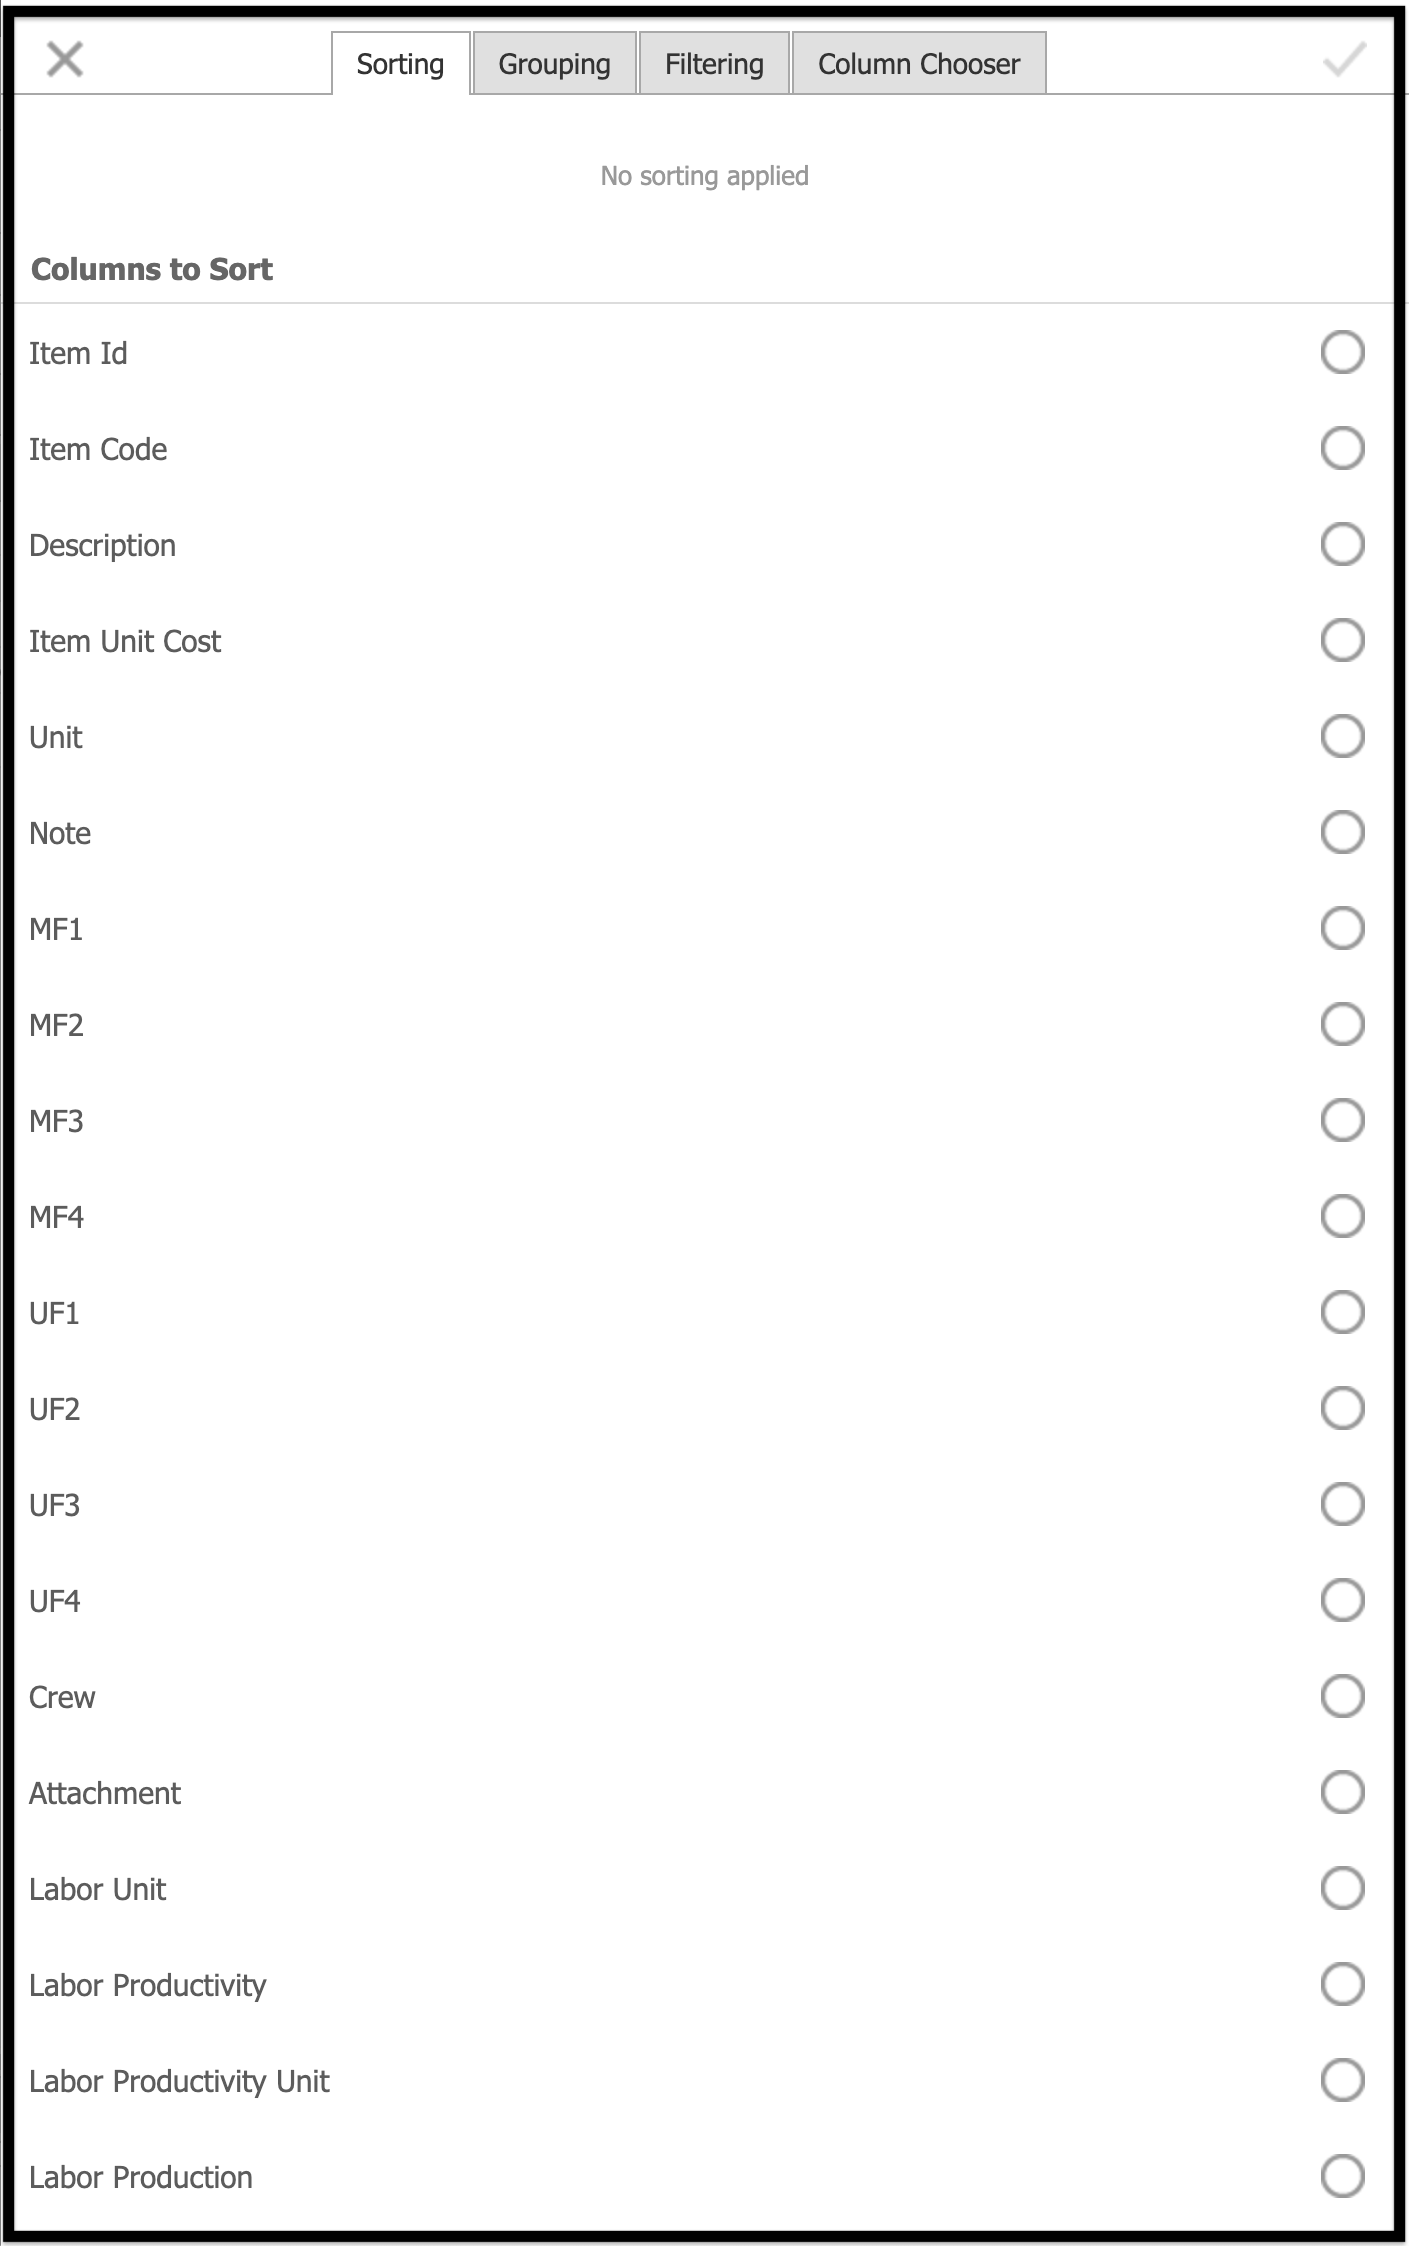
Within the Customize Layout feature, there are four available tabs:
- Sorting
- Grouping
- Filtering
- Column Chooser
Each tab allows you to apply the named function on many of the fields within the Cost Database. Click on the circle to the right of the fields you would like to include in the Database Viewer.
The following fields are available for selection:
| Item ID | Item Code | Description |
| Item Unit Cost | Unit | Note |
| MF1 | MF2 | MF3 |
| MF4 | UF1 | UF2 |
| UF3 | UF4 | Crew |
| Attachment | Labor Unit | Labor Productivity |
| Labor Productivity Unit | Labor Production | Labor Production Units |
| Labor Unit Cost | Material Price | Material Unit |
| Material Conversion | Material Conversion Units | Material Unit Cost |
| Eqp Price | Eqp Unit | Eqp Unit Cost |
| Created by | Created (date) | Updated By |
| Updated (date) | Cost Date | Group Link |
| Cost Note | Status |
Escalation #
Source #
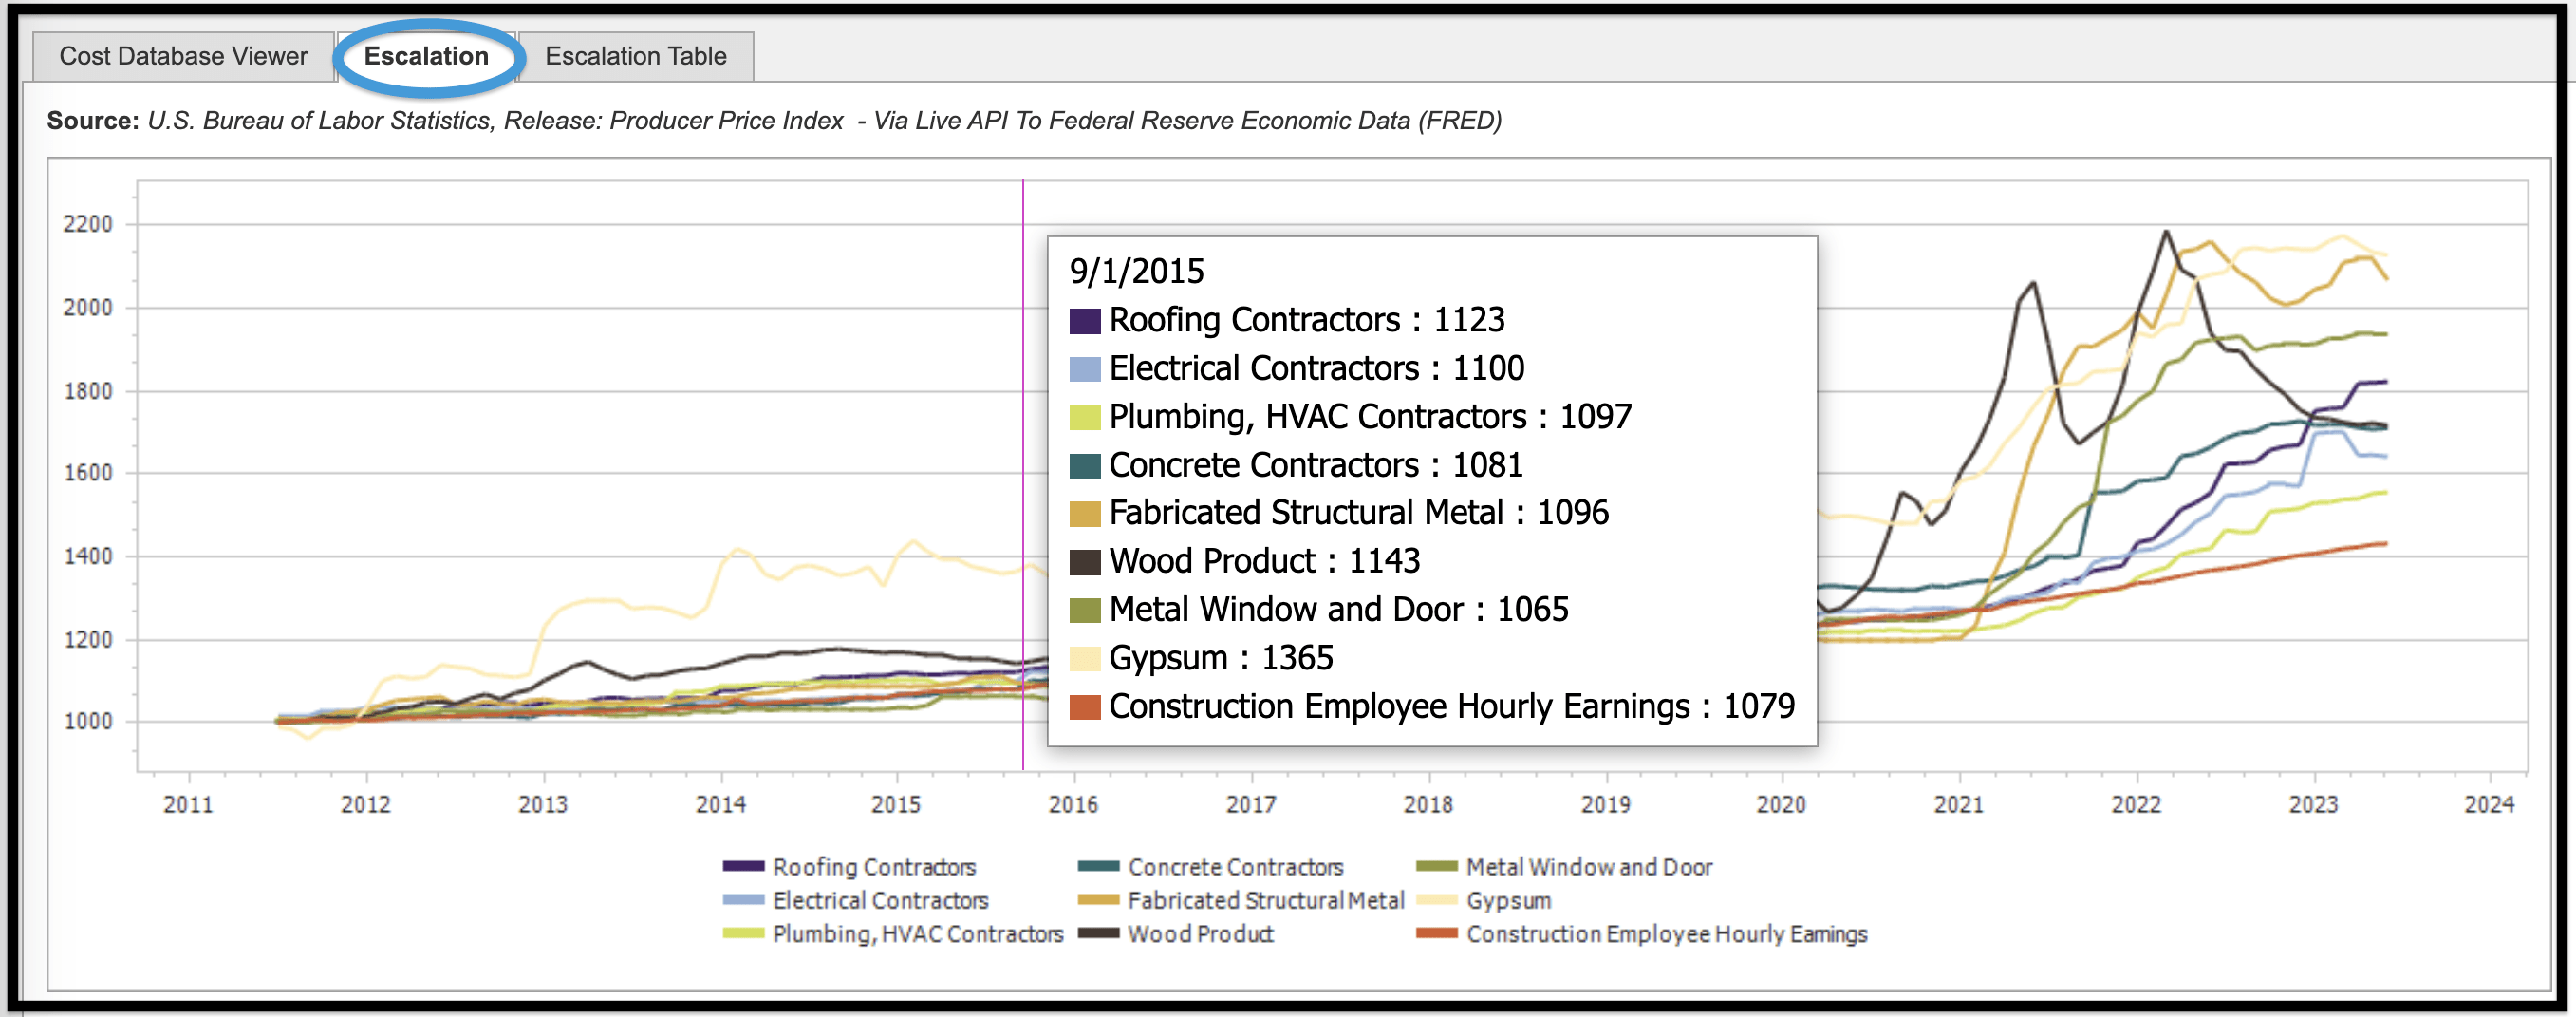
The Source graph depicts data for select Producer Price Indexes (PPIs) published monthly by the U.S. Bureau of Labor Statistics. An API connection to the Federal Reserve Economic Data (FRED) ensures current information. Client administrators update the data in the Estimating Admin Module, Escalation Maintenance section by selecting Update Table From API in the Escalation Maintenance Matrix. While the information is updated by FRED monthly, client administrators have access to perform an update at any time. Once the update has been done, the latest information will be visible on the Escalation graphs and will populate throughout the module.

FOS Building Index #
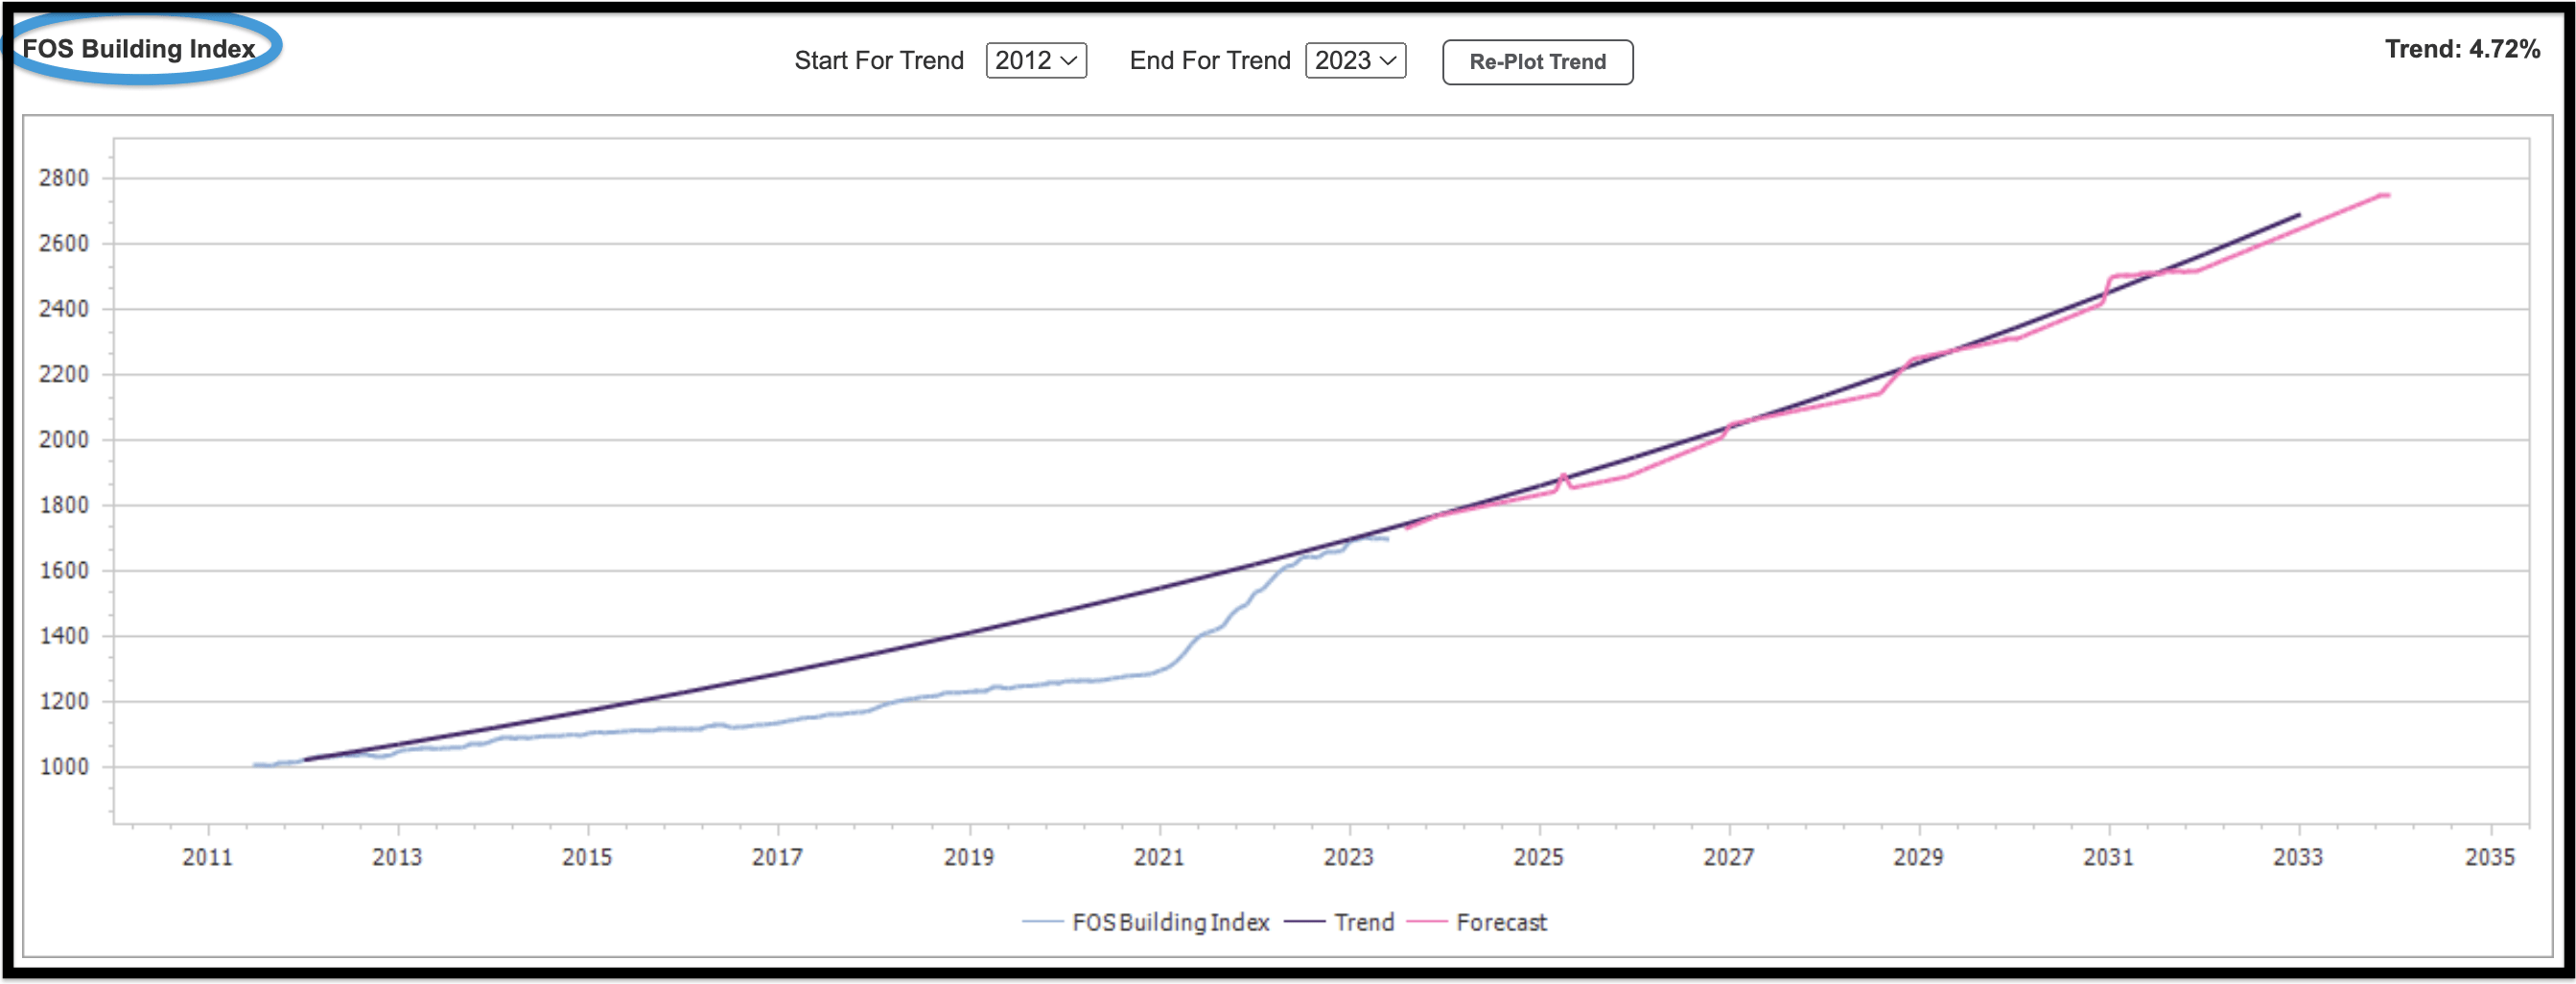
The system plots a default trend line and allows you to perform analysis by changing the start and end dates of the trend line as desired. There are three sets of data in this graph:
- FOS Building Index
- The FOS Building Index is based on the PPI values shown in the Source chart with a proprietary weighting applied; historical and current data is represented by the blue line on the graph.
- Trend
- This is determined by the years selected in the Start For Trend and End For Trend drop-down boxes.
- To change a trend, change the values in the drop-down boxe(s).
- The trend is represented by the purple line in the graph as well as a percentage value in the upper right corner above the graph.
- This is determined by the years selected in the Start For Trend and End For Trend drop-down boxes.
- Forecast
- This is derived from values entered in the Escalation Maintenance section of Admin and is represented by the pink line on the graph.
Moving your mouse along the graph will display hover notes showing data for a particular period in time.
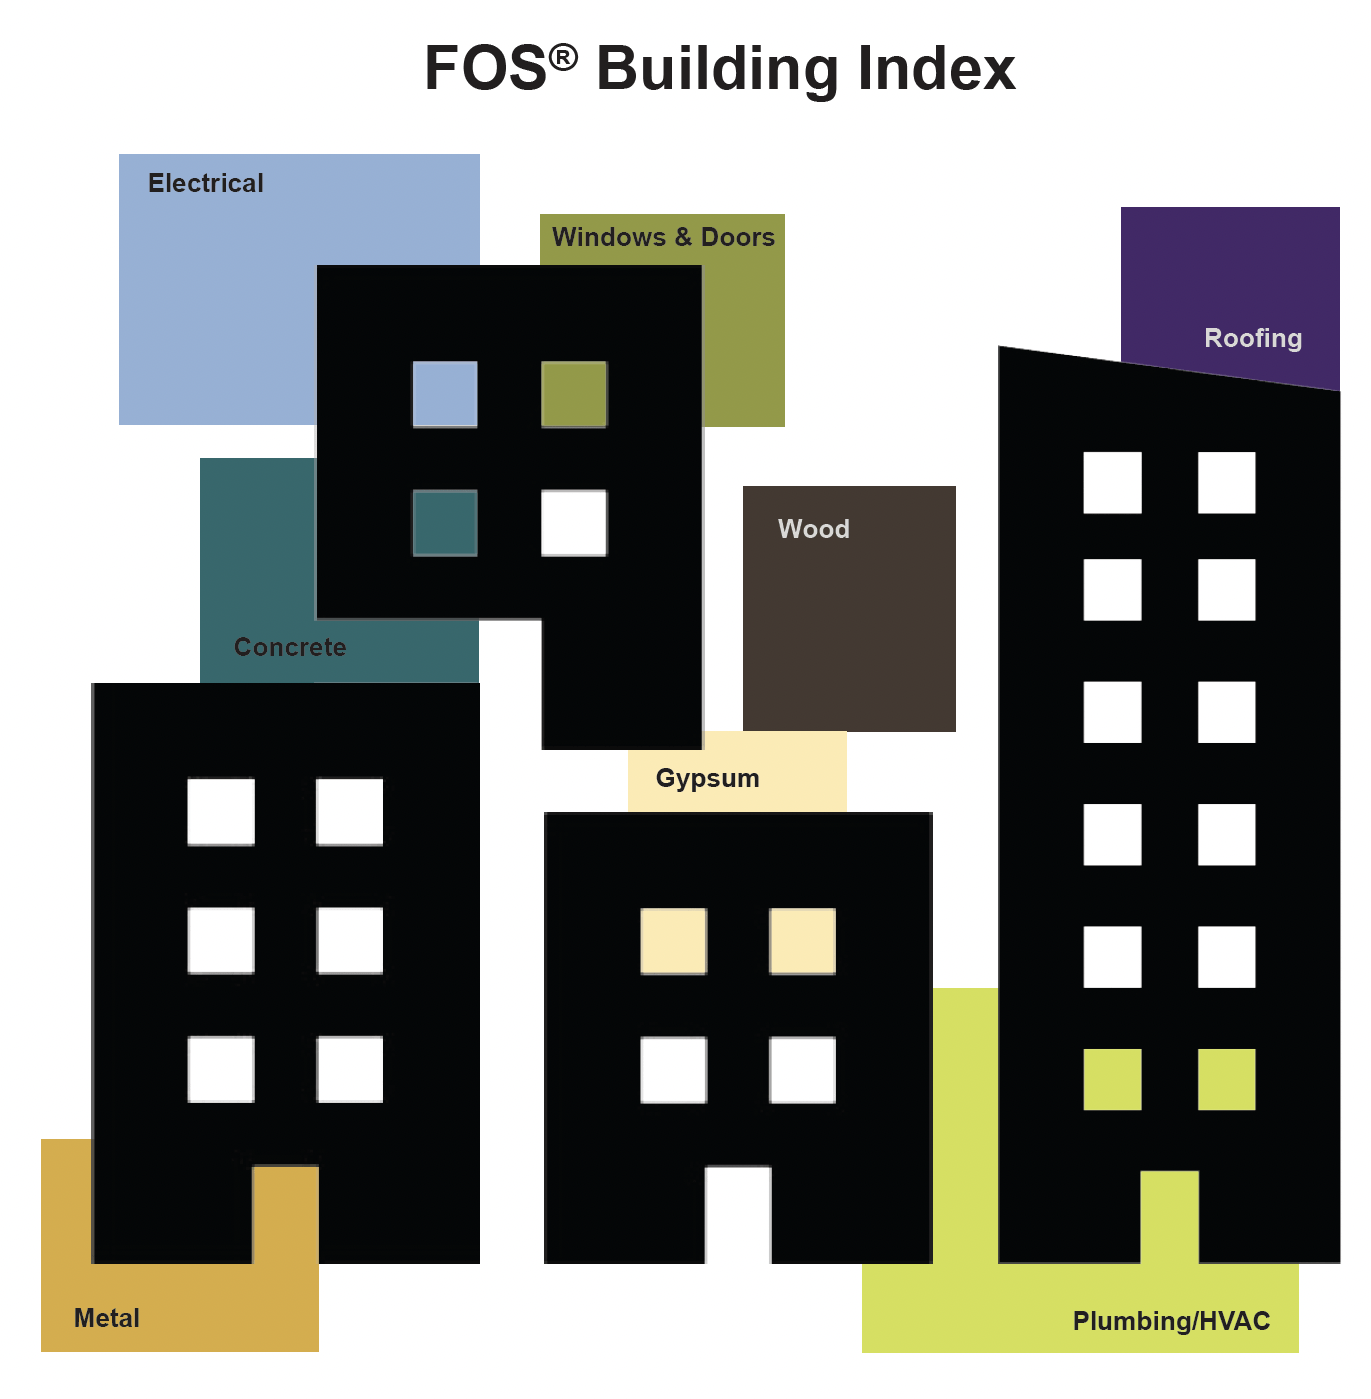
The below image is a conceptual representation the FOS® Building Index.
Percentage Change From Prior Year #
This graph is based on the same data as the FOS Building Index but displays a percentage change from the prior year. Once again, blue represents historical and current data while pink represents forecast data.

Escalation Table #
Data Grid #
The Escalation Table represents the FOS Building Index data in a grid format and can be used to forecast costs.

Calculating Forecasted Cost #
Using the drop-down menus located above the Escalation Table, you are able to extrapolate different cost and escalation scenarios for comparison purposes.

- Value Entries
- Escalate From
- Escalate To
- Base Cost
- Results
- Total Escalation
- Escalation Per Year
- Forecasted Cost
Reference Admin #
Escalation Matrix Maintenance #
The Escalation Matrix Maintenance grid is available for authorized users in the Estimating Admin section of the software. As in the Escalation tabs, the blue-shaded areas represent historical values up until the Department of Labor’s most current data. The pink cells are available for you to enter user-defined values that may deviate from standard projections, for example, if local conditions have changed in such a way that they would influence future costs. Revising the value in one month will result in all future months being recalculated.

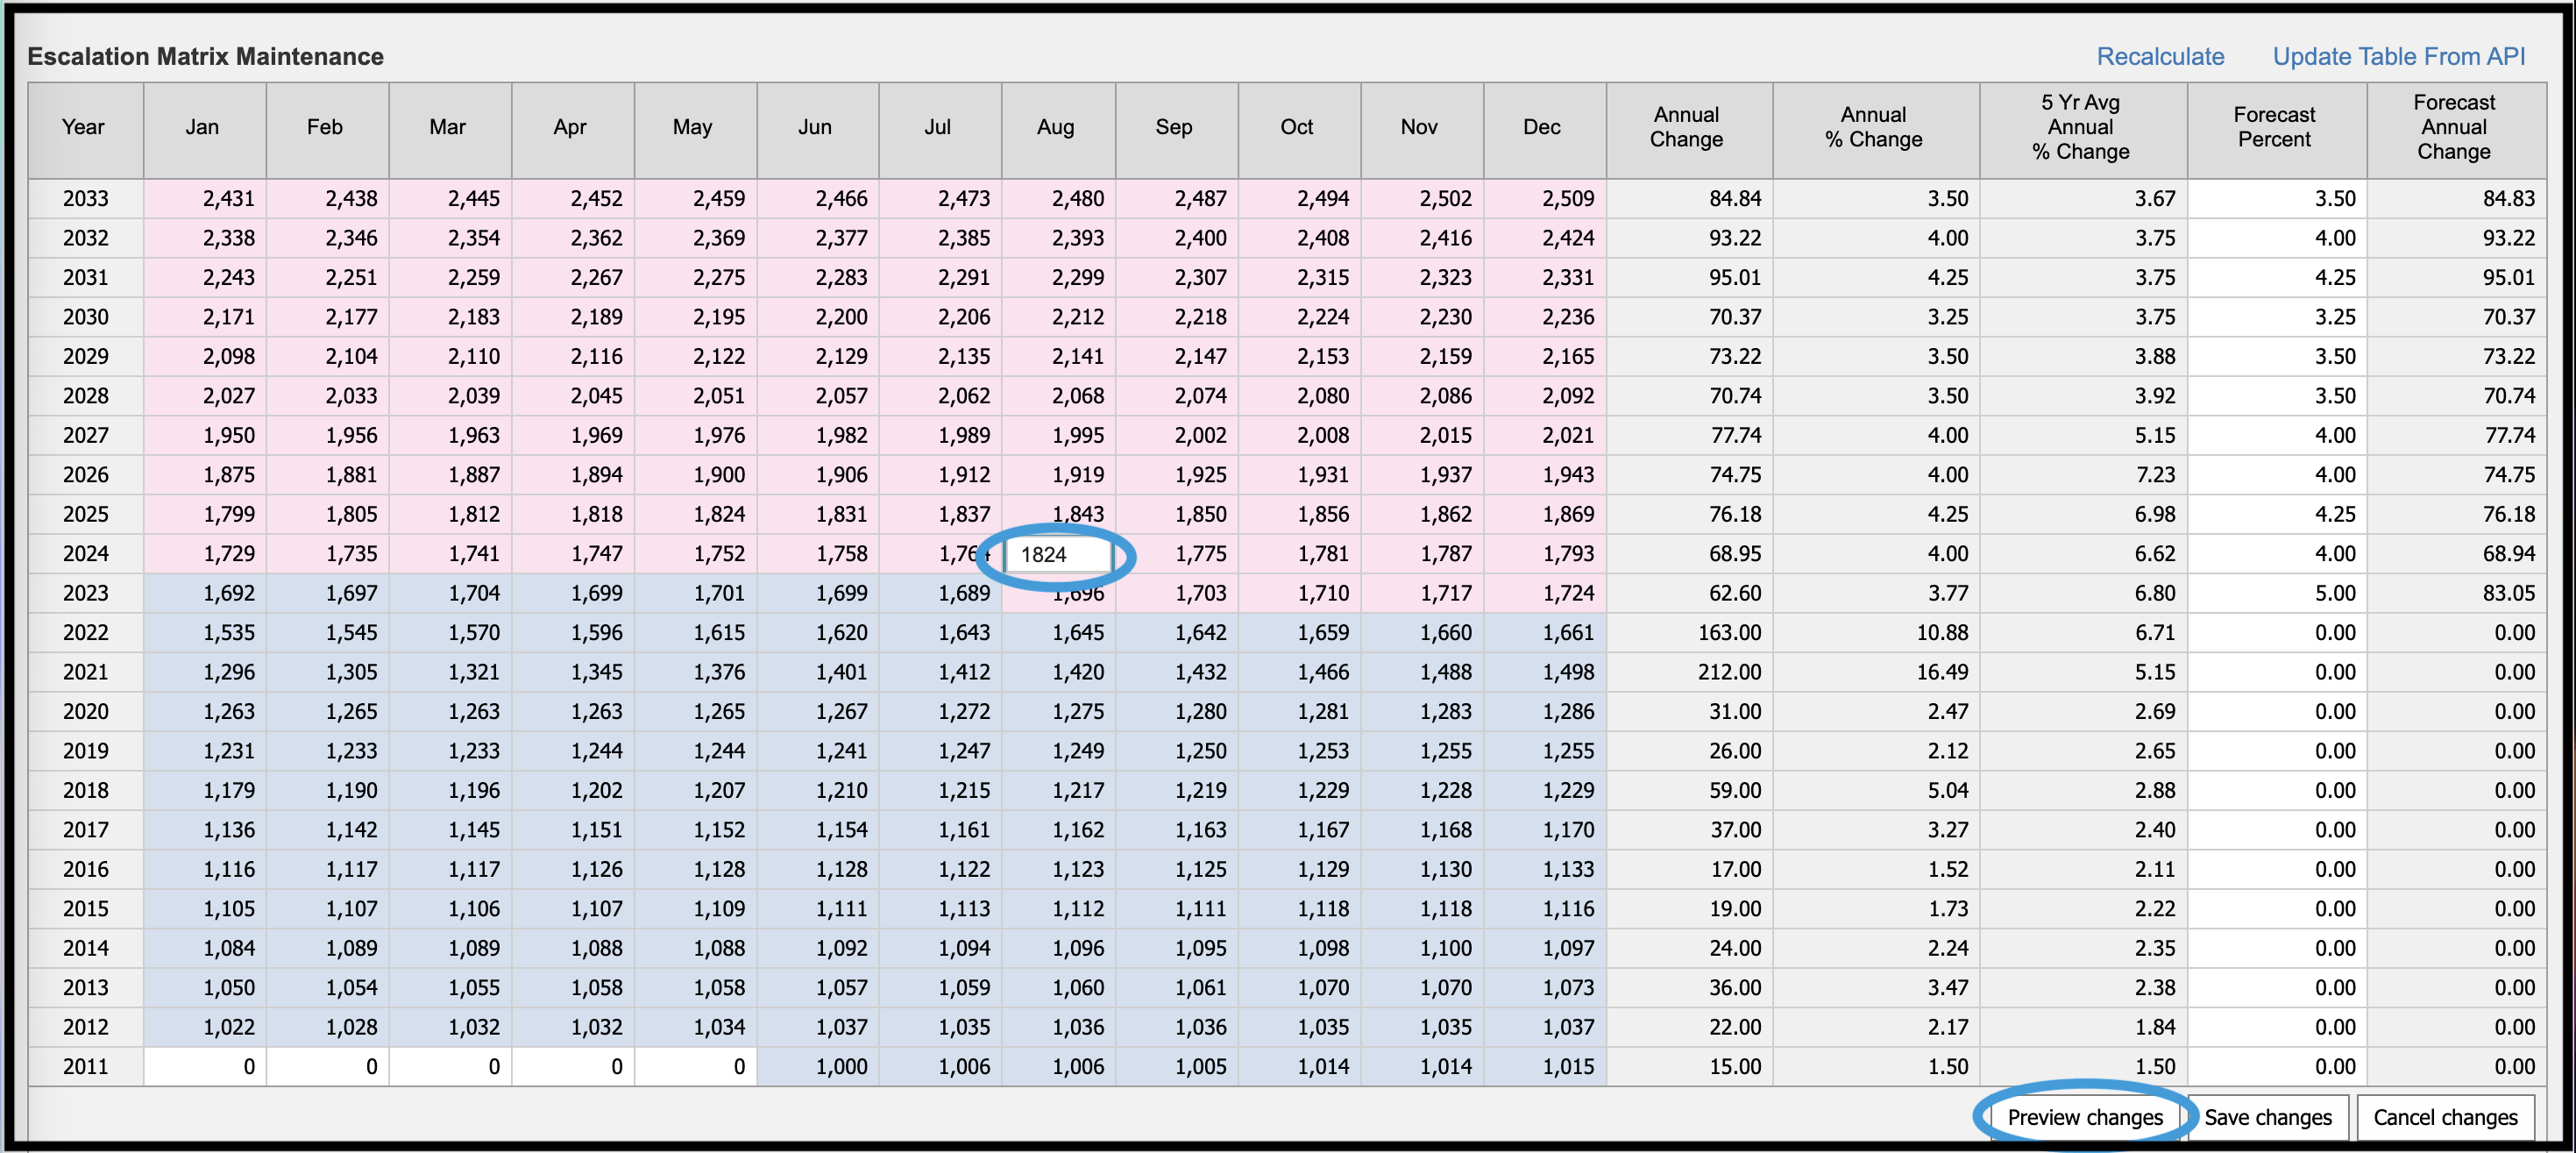
Once the desired update has been performed, click Preview changes to see review, Save changes to save, and Recalculate to finalize the update. Some rounding to whole numbers may occur.

Update Table From API #
To update historic PPI data and the FOS Building Index (FBI), click the Update Table From API link. The most recent information available from the Federal Reserve Economic Data (FRED) API then be available in the system.

© Copyright 2024, FOS of CannonDesign – All Rights Reserved – Confidential and Proprietary